Patterns and spread
- 1
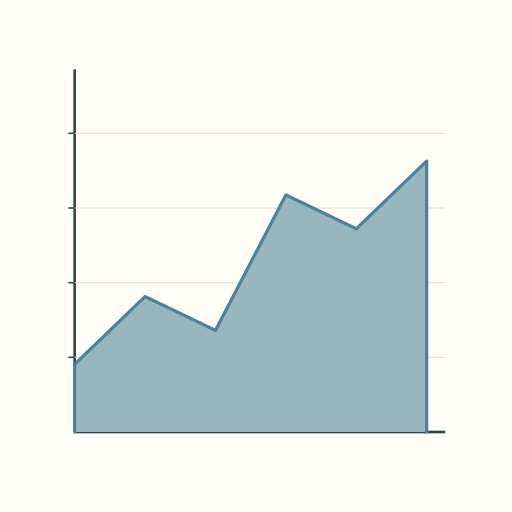
Area chart
- 2
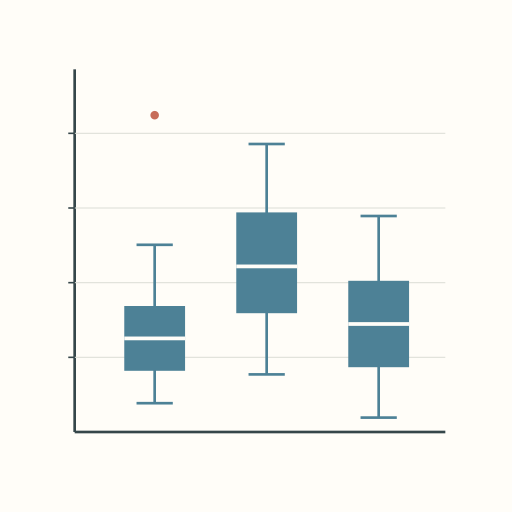
Boxplot
- 3
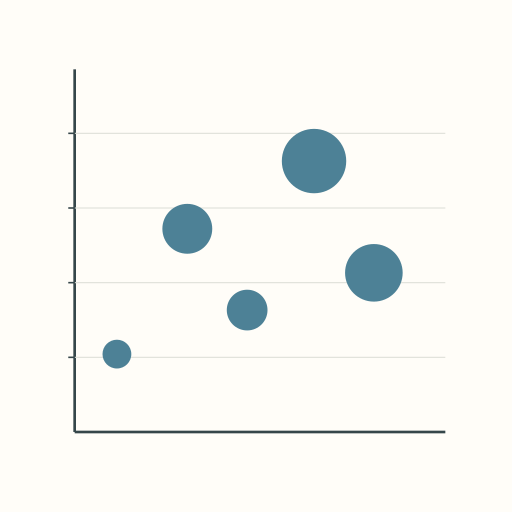
Bubble chart
- 4
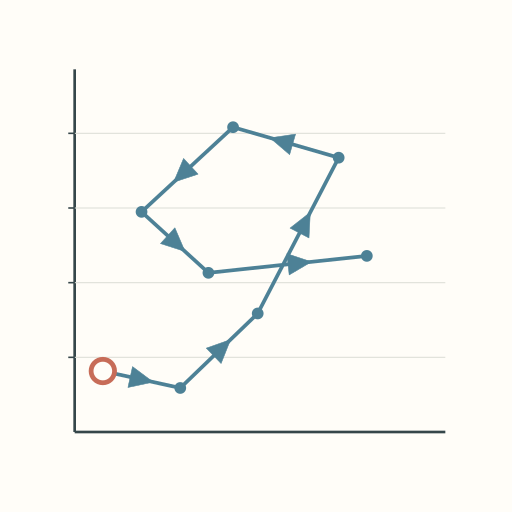
Connected scatterplot
- 5
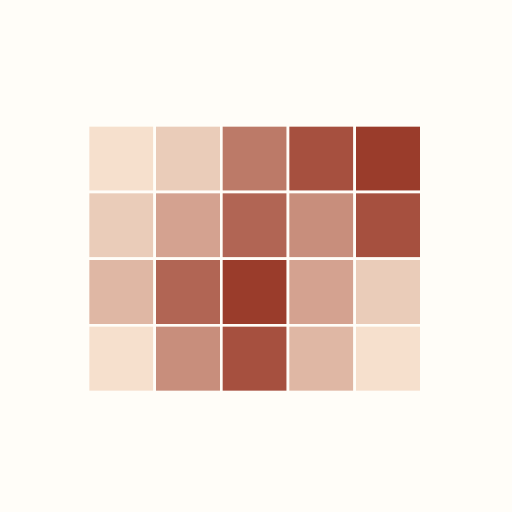
Heatmap
- 6
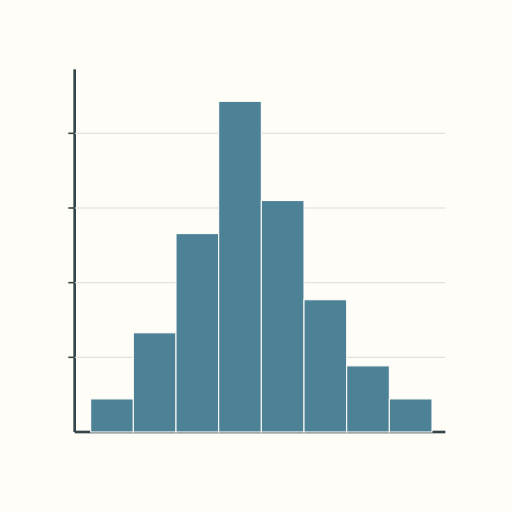
Histogram
- 7
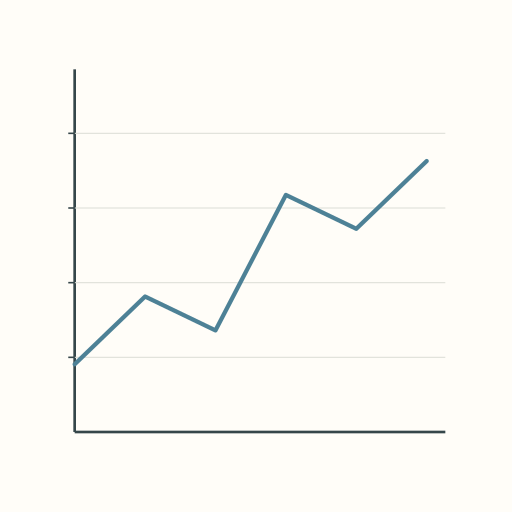
Line chart
- 8
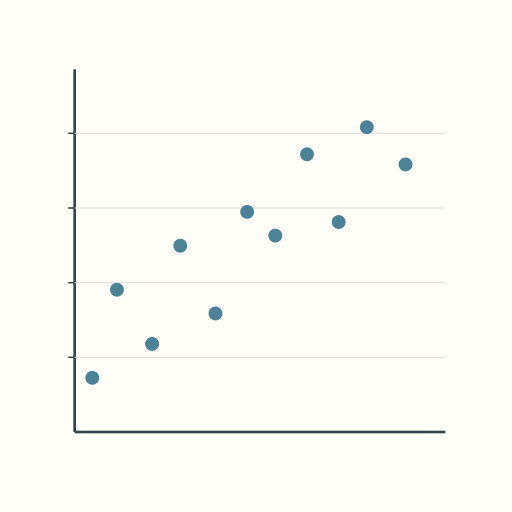
Scatterplot
- 9
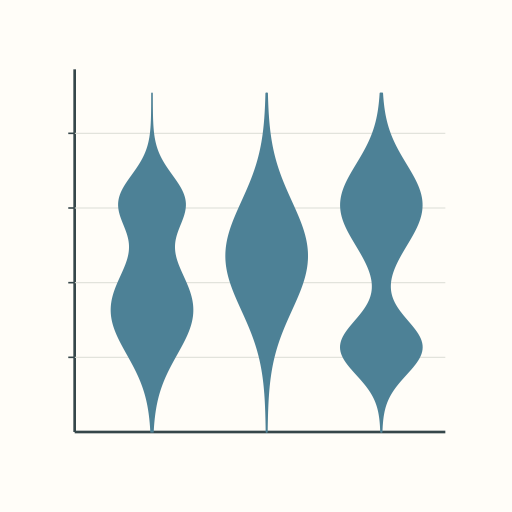
Violin plot
Collections like this
See more
Popular picks
Loading popular picks…
Share a list of your own
Create a collection or make a board with these picks.
Browse collectionsAbout this collection9 items
Scatterplots, distributions and ordered series for exploring patterns in values.
A themed selection by Fav Tings. Alphabetical order is for browsing, not a ranking.
Numbers show collection order, not a source rating.
- Area chart — Original diagram · synthetic values
- Boxplot — Original diagram · synthetic values
- Bubble chart — Original diagram · synthetic values
- Connected scatterplot — Original diagram · synthetic values
- Heatmap — Original diagram · synthetic values
- Histogram — Original diagram · synthetic values
- Line chart — Original diagram · synthetic values
- Scatterplot — Original diagram · synthetic values
- Violin plot — Original diagram · synthetic values
Chart type sources
- Area chart: about these diagrams · A filled region extends from a value line to its zero baseline. Original explanatory diagram drawn by Fav Tings from synthetic values. It illustrates the chart form and shows no real data; no third-party artwork or data was used and no licence is granted.
- Boxplot: about these diagrams · Three box-and-whisker summaries show quartiles, medians, whiskers and an outlier. Original explanatory diagram drawn by Fav Tings from synthetic values. It illustrates the chart form and shows no real data; no third-party artwork or data was used and no licence is granted.
- Bubble chart: about these diagrams · Points use two position coordinates and proportional circle area. Original explanatory diagram drawn by Fav Tings from synthetic values. It illustrates the chart form and shows no real data; no third-party artwork or data was used and no licence is granted.
- Connected scatterplot: about these diagrams · Paired quantitative coordinates are connected in sequence with directional arrowheads. Original explanatory diagram drawn by Fav Tings from synthetic values. It illustrates the chart form and shows no real data; no third-party artwork or data was used and no licence is granted.
- Heatmap: about these diagrams · A matrix of cells uses a sequential color scale to encode magnitude. Original explanatory diagram drawn by Fav Tings from synthetic values. It illustrates the chart form and shows no real data; no third-party artwork or data was used and no licence is granted.
- Histogram: about these diagrams · Adjacent equal-width bins encode frequencies of a quantitative variable. Original explanatory diagram drawn by Fav Tings from synthetic values. It illustrates the chart form and shows no real data; no third-party artwork or data was used and no licence is granted.
- Line chart: about these diagrams · A single line connects values at uniformly ordered horizontal positions. Original explanatory diagram drawn by Fav Tings from synthetic values. It illustrates the chart form and shows no real data; no third-party artwork or data was used and no licence is granted.
- Scatterplot: about these diagrams · Unconnected points encode two quantitative coordinates. Original explanatory diagram drawn by Fav Tings from synthetic values. It illustrates the chart form and shows no real data; no third-party artwork or data was used and no licence is granted.
- Violin plot: about these diagrams · Mirrored synthetic density profiles show differently shaped distributions. Original explanatory diagram drawn by Fav Tings from synthetic values. It illustrates the chart form and shows no real data; no third-party artwork or data was used and no licence is granted.
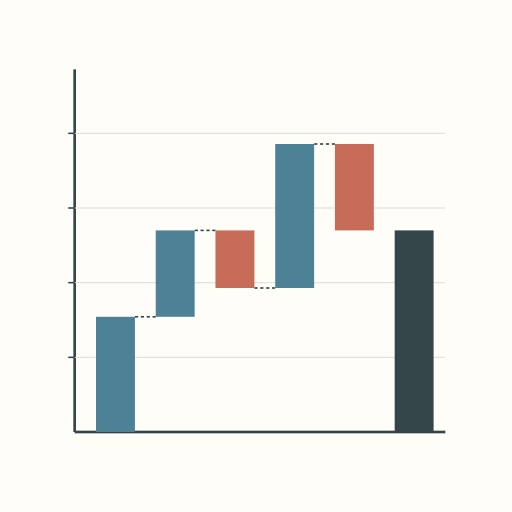
Chart type images are original explanatory diagrams drawn by Fav Tings from synthetic values, not real data or copies of published charts. No licence is granted.
Chart types: original diagrams drawn by Fav Tings from synthetic values.