Comparisons and proportions
- 1
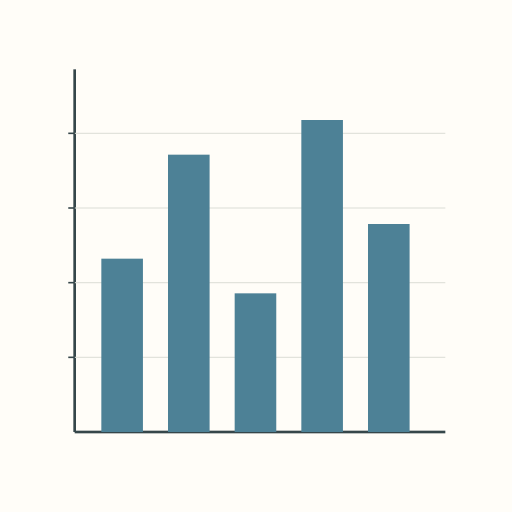
Bar chart
- 2
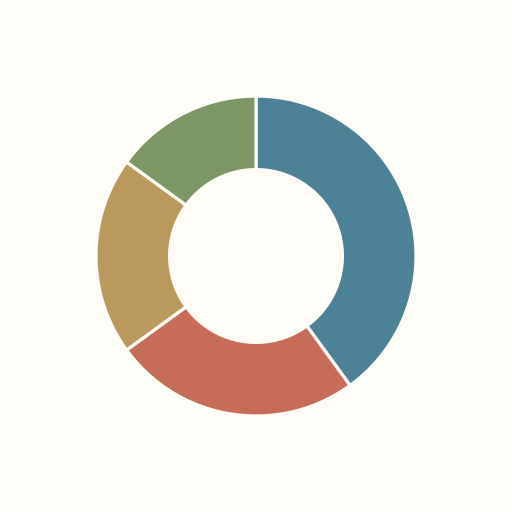
Donut chart
- 3
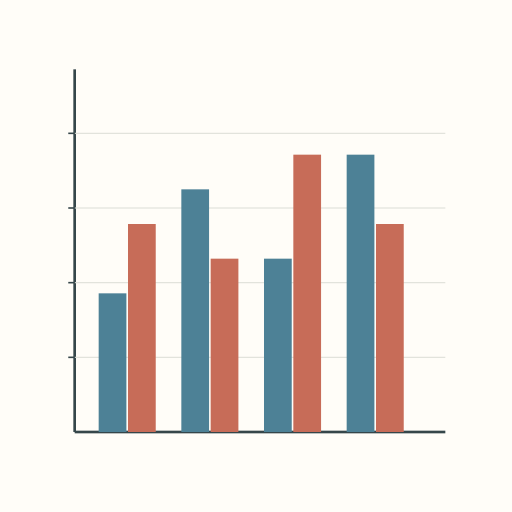
Grouped bar chart
- 4
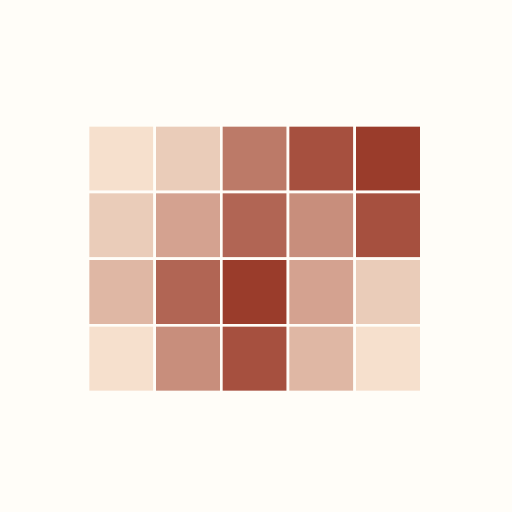
Heatmap
- 5
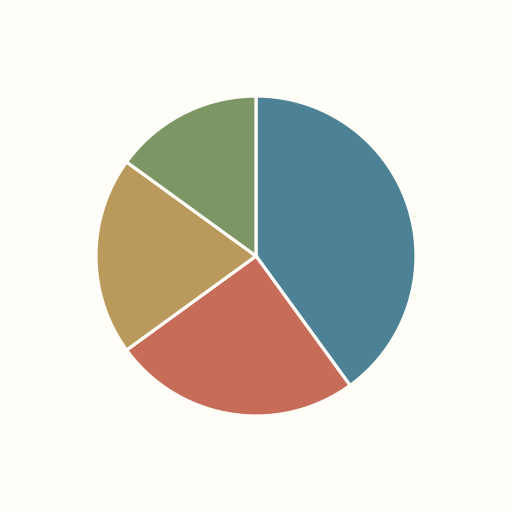
Pie chart
- 6
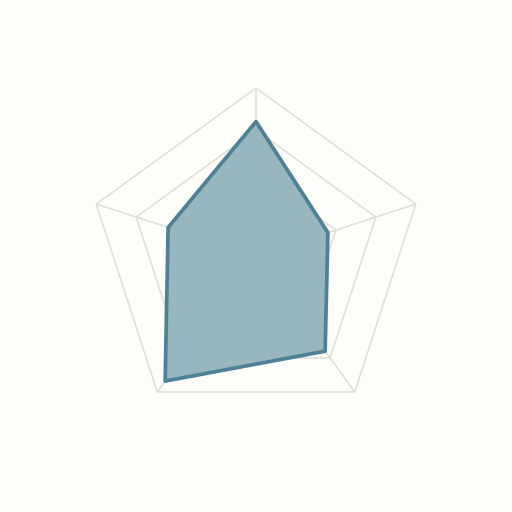
Radar chart
- 7
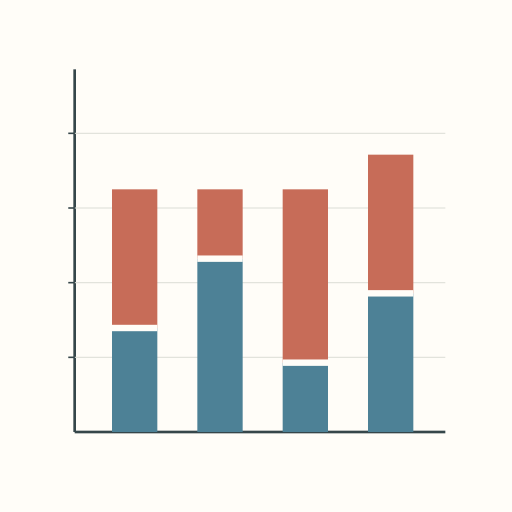
Stacked bar chart
- 8
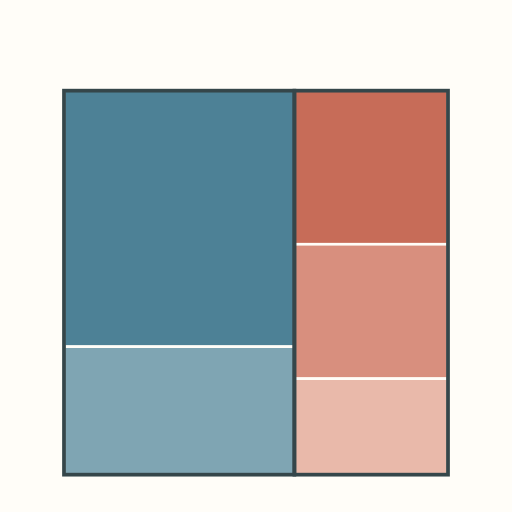
Treemap
- 9
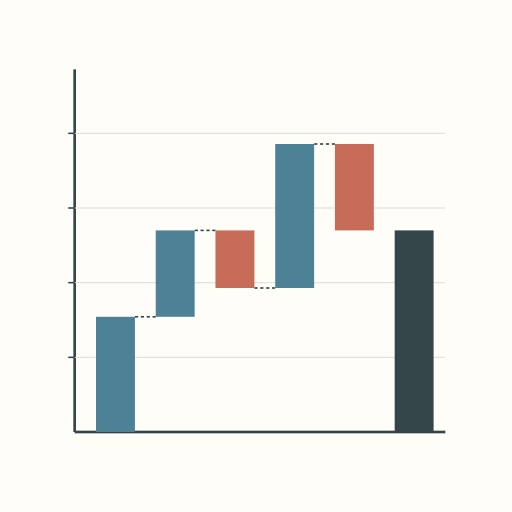
Waterfall chart
Collections like this
See more
Popular picks
Loading popular picks…
Share a list of your own
Create a collection or make a board with these picks.
Browse collectionsAbout this collection9 items
Compare values, parts and totals with bars, treemaps, pies, waterfalls and related forms.
A themed selection by Fav Tings. Alphabetical order is for browsing, not a ranking.
Numbers show collection order, not a source rating.
- Bar chart — Original diagram · synthetic values
- Donut chart — Original diagram · synthetic values
- Grouped bar chart — Original diagram · synthetic values
- Heatmap — Original diagram · synthetic values
- Pie chart — Original diagram · synthetic values
- Radar chart — Original diagram · synthetic values
- Stacked bar chart — Original diagram · synthetic values
- Treemap — Original diagram · synthetic values
- Waterfall chart — Original diagram · synthetic values
Chart type sources
- Bar chart: about these diagrams · Separate equal-width columns encode five categorical values from a zero baseline. Original explanatory diagram drawn by Fav Tings from synthetic values. It illustrates the chart form and shows no real data; no third-party artwork or data was used and no licence is granted.
- Donut chart: about these diagrams · Four sectors partition an annular ring. Original explanatory diagram drawn by Fav Tings from synthetic values. It illustrates the chart form and shows no real data; no third-party artwork or data was used and no licence is granted.
- Grouped bar chart: about these diagrams · Side-by-side columns compare two series in each category. Original explanatory diagram drawn by Fav Tings from synthetic values. It illustrates the chart form and shows no real data; no third-party artwork or data was used and no licence is granted.
- Heatmap: about these diagrams · A matrix of cells uses a sequential color scale to encode magnitude. Original explanatory diagram drawn by Fav Tings from synthetic values. It illustrates the chart form and shows no real data; no third-party artwork or data was used and no licence is granted.
- Pie chart: about these diagrams · Four sectors partition a circle in proportion to their values. Original explanatory diagram drawn by Fav Tings from synthetic values. It illustrates the chart form and shows no real data; no third-party artwork or data was used and no licence is granted.
- Radar chart: about these diagrams · Five radial axes encode normalized values, joined as a closed polygon. Original explanatory diagram drawn by Fav Tings from synthetic values. It illustrates the chart form and shows no real data; no third-party artwork or data was used and no licence is granted.
- Stacked bar chart: about these diagrams · Two segment colors stack to show category totals and composition. Original explanatory diagram drawn by Fav Tings from synthetic values. It illustrates the chart form and shows no real data; no third-party artwork or data was used and no licence is granted.
- Treemap: about these diagrams · Two nested rectangular groups partition the area into five proportional leaves. Original explanatory diagram drawn by Fav Tings from synthetic values. It illustrates the chart form and shows no real data; no third-party artwork or data was used and no licence is granted.
- Waterfall chart: about these diagrams · Floating positive and negative steps accumulate to a final total bar. Original explanatory diagram drawn by Fav Tings from synthetic values. It illustrates the chart form and shows no real data; no third-party artwork or data was used and no licence is granted.
Chart type images are original explanatory diagrams drawn by Fav Tings from synthetic values, not real data or copies of published charts. No licence is granted.
Chart types: original diagrams drawn by Fav Tings from synthetic values.